The server status pages let you monitor what your Plex Media Server is doing and how it’s being used. There are a few ways to get to those pages.
Top Bar
Click the Activity menu in the top action bar, which will give you more options described below.

Server Settings
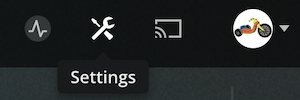
Click on Settings in the top bar. Scroll down on the left to the Status area directly below your server name.
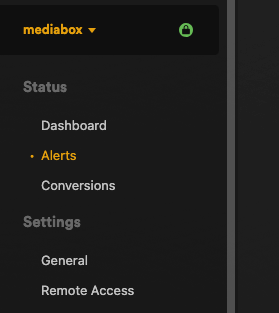
There are three main Status areas/pages:
Activity Menu Item
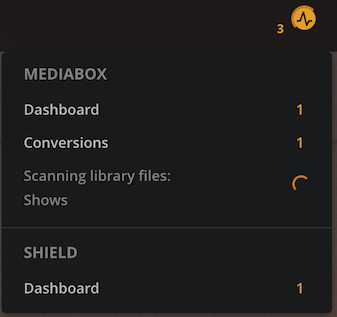
When server activities such as playing or using the transcoder the icon will change to orange and a badge number will indicate how many things are going on. When a scan or metadata refresh process of one of your libraries it taking place, a line will rotate around the icon.


Clicking the Activity icon will display a menu with an entry for each of the Plex Media Servers that you administer. Each entry can include a link to the server Dashboard as well as list whether a Conversion or Scan is in progress. Clicking an individual entry will take you to the corresponding page.
Related Page: Opening Plex Web App
Note: Credit detection and Chapter Thumb generation will not show real time progress.
Dashboard
Note: Full Dashboard functionality requires Plex Media Server v1.15.3 or newer and Plex Web App v3.95.1 or newer.
Your Dashboard is a window into what’s going on with your Plex Media Server. It can show information about items currently being played, bandwidth usage, top users, play history, and more.
The name of current Plex Media Server for which you’re viewing information will be displayed at the top.
Tip!: “Now Playing” information is free for all users. Other Dashboard data is a premium feature and requires an active Plex Pass subscription.
Now Playing
At the top of the Dashboard, you can see media that’s currently being played from the server in the Now Playing area at the top. If the user is signed in to their Plex account, you’ll see their name on the Now Playing entry. This includes playback both locally and from shared users.
Toggle the button on the top-right to expand or collapse the playback information. This can include stream details such as codec or language, whether or not the streams are being transcoded, resolution, and more.
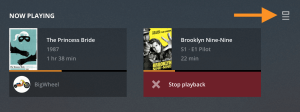
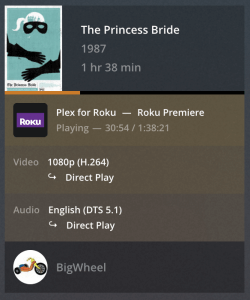
If you’ve enabled “video preview thumbnails” for your content, you’ll see those displayed when you mouse over the Now Playing item, which gives you a view of where the playback is within the media.
Related Page: Video Preview Thumbnails
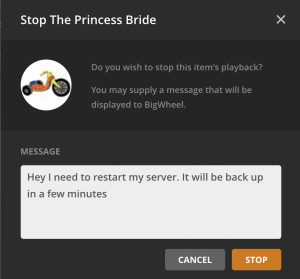
Plex Pass subscribers can hover over the user information at the bottom to reveal a Stop playback button. With this, you can choose to force the playback to stop and optionally send a message to the user about why the playback was stopped.
Bandwidth (Plex Pass)
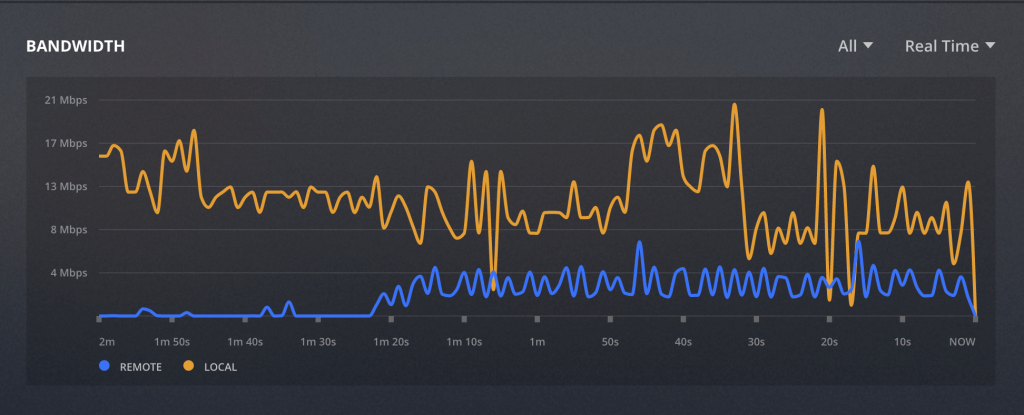
(The bandwidth information requires an active Plex Pass subscription.)
The bandwidth graph shows real time or historical data about bandwidth used by the Plex Media Server, both over the local network and remotely. The bandwidth data will include not only media playback, but also things such as DVR program guide refreshes, client connectivity tests, and similar (it even includes the bandwidth used to send the data to the web app to display the bandwidth graph… it’s like “Inception”!). You can view both the local and remote data together (the default) or choose to display only one of them. It’s also possible to switch from the default Real Time view to instead display historical data, such as the last 7 days, last month, etc.
Bandwidth data is gathered when running Plex Media Server version 1.14.1 or newer. You won’t have historical data from playbacks or activity that occurred when running older server versions.
Note: The bandwidth only measures data that actually leaves the server device, whether going out over the local network or remotely. This means that if you use a client/player app on the same machine as the Plex Media Server, that playback won’t generate bandwidth data (since the streaming is local on the same device).
CPU Usage (Plex Pass)
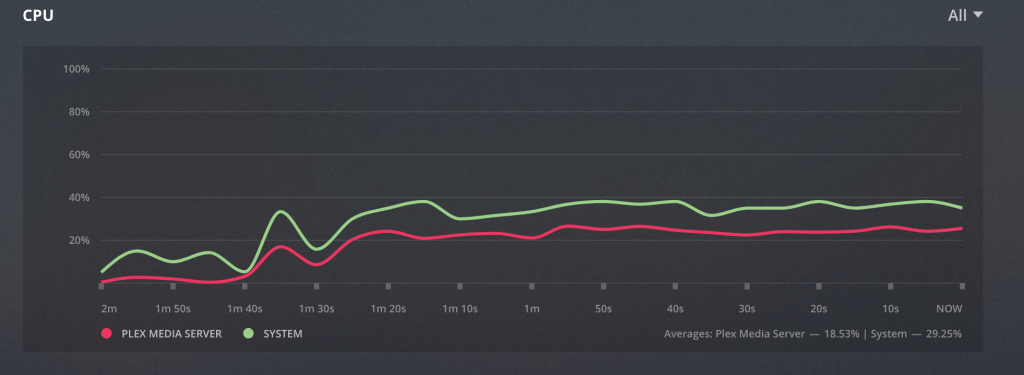
Real time CPU usage of your system and the Plex Media Server.
Note: Due to system limitations, CPU monitoring is not available on FreeBSD or NVIDIA SHIELD server systems.
RAM Usage (Plex Pass)
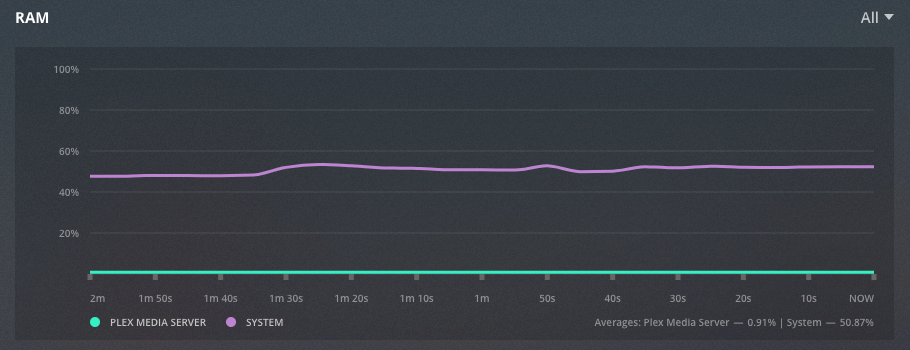
RAM usage on the Plex Media Server machine.
Note: Due to system limitations, RAM monitoring is not available on FreeBSD or NVIDIA SHIELD server systems.
Top Users (Plex Pass)
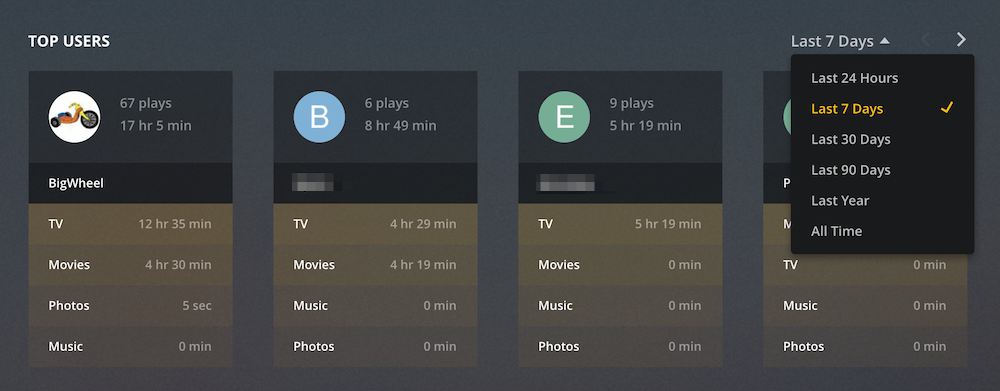
(The Top Users information requires an active Plex Pass subscription.)
View the users who have played the most media from that Plex Media Server over the selected time period. The amount of time spent watching each of the media types will be listed.
Play History (Plex Pass)
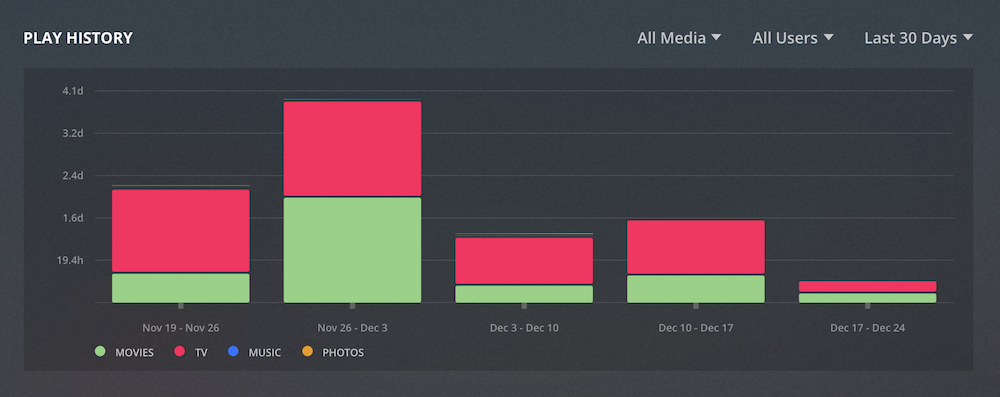
(The Play History information requires an active Plex Pass subscription.)
Play History displays the historical amount of time users have spent playing items over the selected time frame. It can be filtered by media type as well as by individual user. The users listed in the drop down will only be the ones that have played media in the selected time frame.
Click on “View Full History” to see a detailed sortable list of information. (some info requires at least server version 1.15.2)

Top Played (Plex Pass)
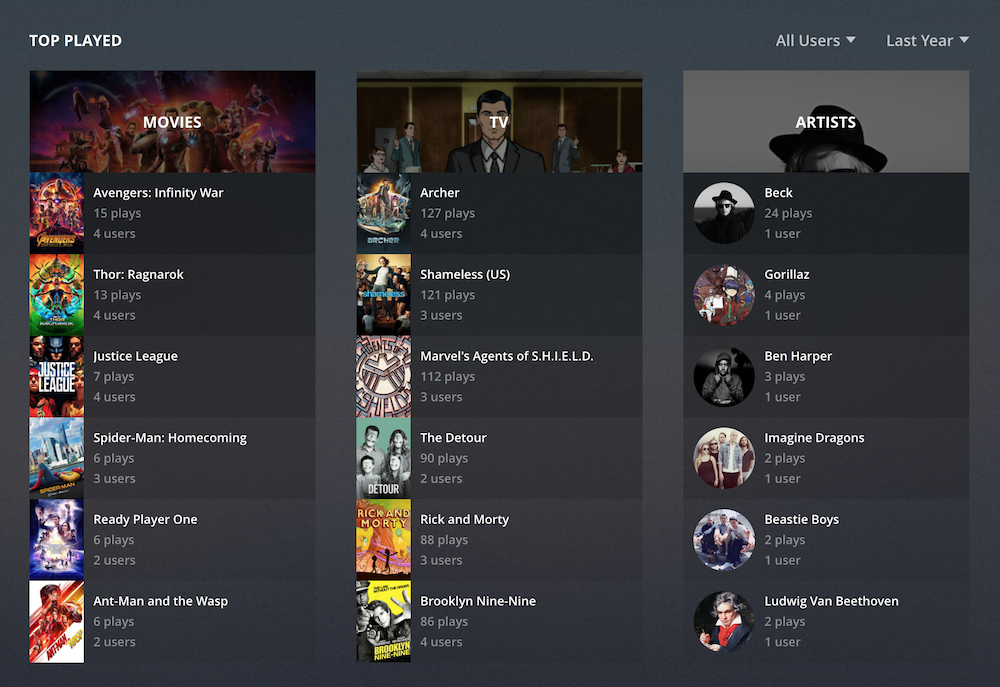
(The Top Played information requires an active Plex Pass subscription.)
In the Top Played section, you can see quick information about the most “popular” (i.e. most commonly played) things for each media type. This shows both the number of times an item has been played in total as well as how many different users played it. You can adjust the time frame for the data being displayed.
Alerts
The Alerts page tell you what the server is currently doing. For example, if you add new media you’ll see the matching status here. If there are many notifications, results are automatically paged. You can see older notifications by choosing an older page at the top right of Notifications.
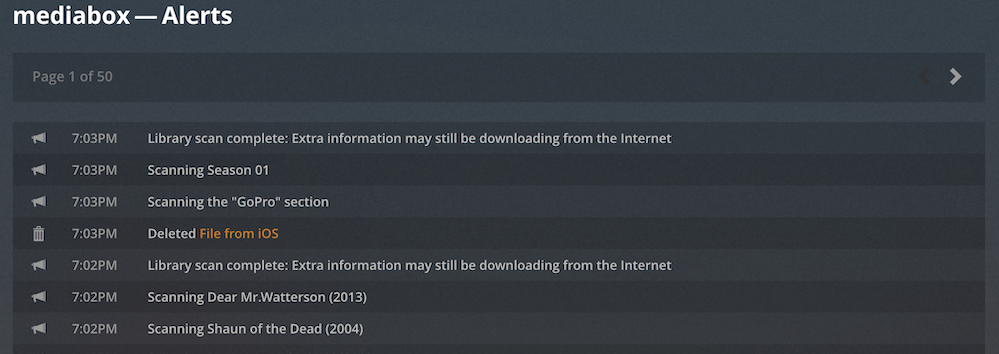
Note: The activity under Alerts here is only for the current browser session. If you reload the browser page or access from a different browser, the Alerts information will start over.
Conversions
The Conversions page shows items that are being transcoded for an Optimized version.


